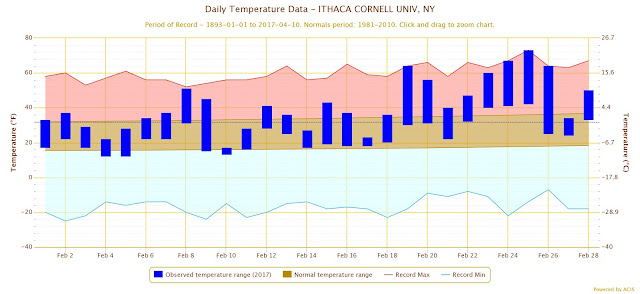
Feburary ended on a warm note. Flowers were blooming and wildlife was out and about. Across the country, spring was a month or more ahead of normal in terms of plant development. Temperatures here actually began around normal after a warm January. However, they steadily climbed higher and higher, eventually ending with a warm wave that set three consecutive record highs at the end of the month.
 |
| Temperatures from Jan to Feb 2017 |
 |
| February in detail |
These charts are thanks to a website that Professor Degaetano used in EAS 2680 Climate Change. The site was http://scacis.rcc-acis.org/. The next chart shows the number of days in February where temperatures exceeded 60 F. It's a rather arbitrary number but it's to illustrate a point. There were 5 days in February 2017 that matched or exceeded 60 F. The other year that did what was 1940. A long time ago. And there really isn't a trend either. The fact is our temperature record was never intended for studying climate. It was originally just to say oh it's 35 degrees out, time to protect plants from frost.

There are so many inconsistencies. For example, Cornell's weather station used to be placed on the roof of Roberts Hall. As one would expect, the sun beating down on black tar would increase temperatures. After the station was moved out to Game Farm Road, logically, temperatures would cool. Regardless of climate change, simply moving the station induced artificial cooling. This also happened across the country. Warm urban sensors were moved to rural areas to airports resulting in perceived cooling. Then when climate scientists use these datasets, they need to apply complex statistical corrections to them, often adjusting them upwards. This gives plenty of material to climate change deniers to grab onto. And on the surface it seems logical. Scientists are adjusting temperatures upwards-maybe to support their conclusions-but they do not see the real reason they do that.

